|
This article originally appeared on Storage Markets' website and is reprinted with their permission.
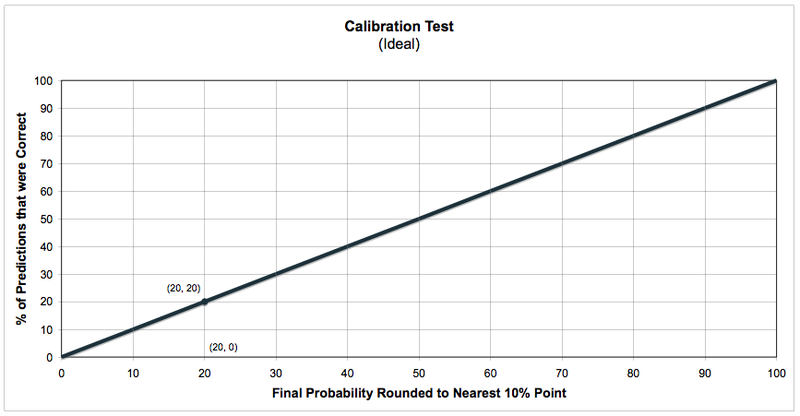
The analysis of the quality of a predictive market is to subject the market environment to a calibration test, monitor the logarithmic score and entropy. This article is the first in a series that discusses the quality of predictions being made by the Storage Markets community. All results indicate the traders at Storage Markets are generating good and improving forecasts and predictions. Background Prediction markets, such as Storage Markets are used to communicate the collective insight of a community of traders to a set of observers. Individual traders are asked to evaluate current predictions of the likelihood of an event occurring and comparing that probabilistic value with the trader's own subjective probabilistic prediction. If the current market prediction is low compared to the probability the trader assigns to the outcome, the trader may choose to buy and hold the security until the market probability assigned to the outcome increases beyond the trader's subjective probability at that time - or until the security expires at a termination value. The counter position of shorting a security is also available to the trader; selling or shorting a security if the current market price (i.e. probability) is too high relative to the individual trader's prospective. Storage Markets uses this virtual financial market to aggregate the subjective probabilistic forecasts of individual traders into a single probabilistic forecast. The analysis of the quality of the community's forecast borrows heavily from the tools used to measure the quality of other subjective probabilistic forecasts, such as weather forecasts. Where a weather forecaster may predict a twenty percent chance of rain tomorrow, a prediction market may communicate a twenty percent probability of a storage industry event occurring in the forth quarter of 2007. There are three statistical tests used to evaluate the quality of prediction markets of the scale and scope of Storage Markets. The Calibration Test provides a metric used in the discussion regarding the market's ability to over or under forecast the. The Logarithmic Score is a metric that can be used to compare the quality of a market's predictions against a so-called "expert". The Entropy metric borrows the concept of decidedness from decision theory to give us insight into how well a market is incorporating new information into its prediction. Calibration Test The primary tool used to evaluate the quality of probabilistic forecasts is the calibration test. A calibration test asks how often a forecaster's prediction of an event, E, is correct given the probability attached with that particular prediction, P(E). For example, define an event, E, where the event is "rain tomorrow". The probabilistic forecast today that it will the event will occur, (i.e. it will rain tomorrow) is twenty percent. E = "Rain Tomorrow" P(E) = 20% Over the course of a test period, a weather forecaster will make a number of predictions, P(E), that it will rain the next day. The predictions will range from 0 to 100% likelihood. The observer measures how often the event does occur, i.e. it rains the next day. The statistician compares the observed frequency of rain for each P(E) against each P(E). To simplify the graphical analysis, the probabilistic forecasts, P(E), are rounded to the nearest value of ten (i.e. 0, 10, 20...80, 90, 100). The horizontal axis refers to the set of possible values of rounded P(E). The vertical axis refers to the actual percentage of times the forecaster was correct for a given value of P(E). For example, if a forecaster, who claimed a twenty percent chance of rain, were correct (e.g. it rained) twenty percent of the time, a data point would be set at (20, 20). Similarly, if it never rained after a prediction of twenty percent, a data point would be set at (20, 0). The linear extrapolation of the ideal probabilistic forecaster creates a forty-five degree line starting at the origin (see below).
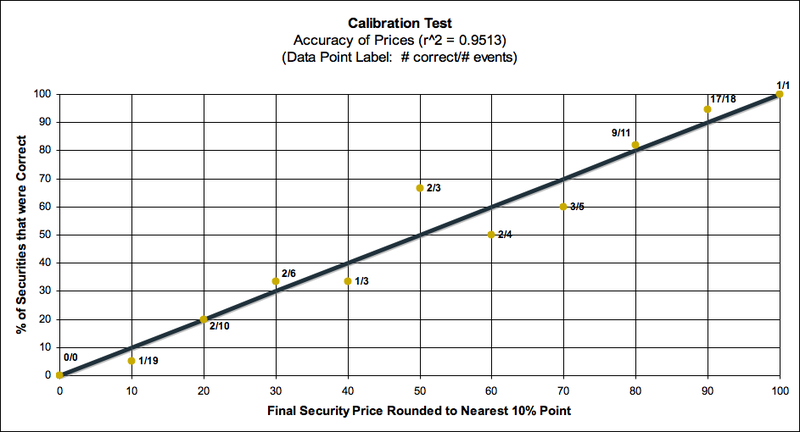
Storage Markets has completed eighty qualifying probabilistic forecasts to date - creating eighty data points. The results are below:
The correlation value of (R2) = 0.9513 is very good. A score of 1.0000 represents the maximum correlation value and perfect calibration. (R2) has a range of possible values (0, 1). |
Storage Markets is a prediction market used by the data storage technologies industry. A community of storage industry professionals, end users, vendors, analysts, and the press trade virtual securities, resulting in valuable market insight.
|
||||